The 7 Important UX KPIs and How to Measure Them

Data analysis is a core part of every business, and the UI/UX industry isn’t left out. With the best UX KPIs, you can easily track, measure, and compare the performance of your UX project right from your comfort home. You can also take advantage of the data gathered to make informed decisions, and predictions that are beneficial to your projects.
Thus, if you are a product designer, or manager we’ve highlighted the best 7 UX KPIs required to evaluate your UX efforts in this post. Also, we added how to measure, and report each one of the UX KPIs. Let’s delve in!
Also read: Top 15 UX Influencers to Follow for 2023 >
What Are User Experience (UX) KPIs?
User Experience Key Performance Indicators, also known as UX KPIs are numerical data often used to determine the progress of your UX product. Not only that, but the data gathered is also used to evaluate the effectiveness of your UX product in relation to your target goal overtime. Additionally, it helps you discover the issues with the product, so you can devise a solution to fix it within the shortest possible time. This data speaks volumes about your product, as it acts like a guide majority of the time.
UX KPIs and UX Metrics: What’s the Difference?
Although UX KPIs and metrics are numerical data, they both have their differences as they offer different reports. UX KPIs measures the success rate while UX Metrics measures how well end-useRs interact with your product.
Top UX KPIs to Track and Measure User Experience
UX KPIs are divided into two main categories, which include behavioral and attitudinal KPIs. Each one has its unique characteristics, which will be discussed in the next paragraphs.
Behavioral KPIs
Behavioral KPIs tell you how often your product or design is being interacted with over time, plus what exactly users are doing with it- all of which are shared in numerical data. Before now, these reports were obtained by conducting interviews, or surveys, which is strenuous, time-consuming, and expensive. But now, we have modernized techniques that are simple, fast, and hassle-free. Check them out below:
1. Task Success Rate
Task Success Rate, also known as TSR, helps you evaluate the number of correctly executed tasks in relation to your product. For instance, you integrated debit, and credit card payment options into your business to ease transaction processing.
Of all the 100% users of your product, just 70% successfully completed a transaction via credit card. However, the remaining 30% struggle to pay via debit cards. This data helps you know exactly where the problem is, and how to solve it.
Most times, since the success rate for one of the surveys is higher, you can neglect the other. As in the case of the example given, you can remove the debit card option for transaction processing. Alternatively, you can go deeply into finding why the debit card option is difficult to complete a transaction.
2. Time on Task
Here is another key UX KPI to look out for when checking the performance of your product. Time of Task tells you how much time it takes users of your product to successfully complete a task. Mind you, this type of UX KPI is usually expressed as an average.
For example, nine respondents are asked to find the customer service contact on your website. Reports of the time taken to successfully get the required information are given in the table below:
| User | A | B | C | D | E | F | G | H | I |
| Time (seconds) | 25 | 17 | 45 | 30 | 27 | 36 | 60 | 31 | 40 |
The average time on task is expressed as follow:
(25 + 17 + 45 + 30 + 27 + 36 + 60 + 31 + 40)/9 = 32.33 seconds. Thus, you can conclude that it takes ~32.33 seconds for users of your product to navigate your site to locate the customer service line which is fair enough but can be worked on.
3. Search vs Navigation
Measuring the search-to-navigation ratio is another important UX KPI you need to checkout as a product manager. You need to check the ease with navigation with relation to the search function you have on your website. What this means in essence is that you compare how often users of your product use the search feature to quickly reach their destination instead of navigating through.
The lower the number search to navigation ratio, the better your product, and user experience. Users of your product should be able to navigate through your platform easily without using the search functionality. Here’s is the formula to successfully measure the search to navigation:
Total Number of Completed Tasks Conducted via Search Function or Navigation
For better understanding of the formula above, let’s check out the case study below:
You asked five usability testers to order a product (let’s say creso lens glasses) from your website, then you too to analyze or compare the number of testers that used the search bar instead of navigation.
4. User Error Rate
Irrespective of whether or not you are the best product designer or manager worldwide, your product can’t be perfect. There will always be an error spotted by users, which you must work to to improve results. So you need to check the User Error Rate on your platform as often as possible.
User Error Rate notifies you of the number of times your product user makes a mistake while trying to access or navigate something. A typical example is the unsuccessful attempt to enter card details (which include CVV, card number, and expiry dates) in the appropriate field.
The User Error Rate helps you understand how easy the users of your product can navigate without encountering any errors. There are two ways to measure the User Error Rate of your product. Find and apply the appropriate formula below:
Attitudinal KPIs
Besides measuring users’ interaction with your product, you also need to understand how they feel, and what they say before, during and after using your product. All of this info is obtained in the form of feedback, and categorised as attitudinal KPI.
Here are the popular attitudinal KPIs to be on the lookout for when measuring the performance of your product:
1. System Usability Scale
System Usability Scale abbreviated SUS is crucial to every product manager. According to John Brooke, the System Usability Scale of any product airs the customer’s view. It’s one of the quickest and trusted means of testing the usability of a product.
SUS is usually obtained after the successful testing of your product. It comes in the form of a questionnaire which usually contains 10 questions covering all of the relevant feedback a user wants to share regarding the usability and learning curve of your product. Participants’ feedback is reported by selecting one of the five-point scale answers shared in the image below:
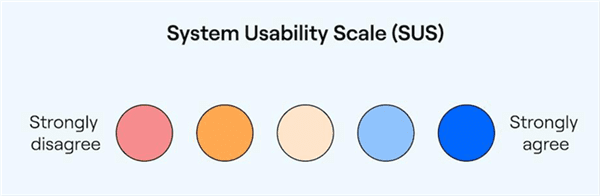
System Usability Scale
where the Strongly Disagree response corresponds to 1 point, and the Strongly Agree corresponds to 5 points. The other responses with colours orange, grey and sky blue represent 2, 3, and 4 points respectively.
Here’s what the questionnaire looks like:
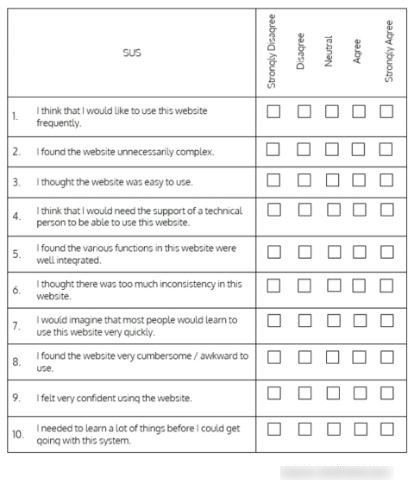
System Usability Scale Questionnaire
To calculate results obtained:
- Note down the points for each answer provided.
- Subtract 1 from the points obtained for each odd numbered question.
- Subtract the corresponding points obtained from each of the even numbered questions from 5.
- Sum the total points and multiple by 2.5.
The resulting points obtained range from 0-100. Reports show that SUS score above 68% is over average, while scores below 68% is less than average.
2. Net Promoter Score
Nothing beats customers’ referral when it comes to marketing in business. Your customers can either increase or decrease the number of potential leads coming to your platform. You can quickly measure this by conducting a survey of the likelihood of your customers to recommend your product. The results obtained is called Net Promoter Score.
To calculate the Net Promoter Score of your product, simply ask the question: How likely are you to recommend this platform to a colleague, relative or friend? Points should be scored using the scale below:
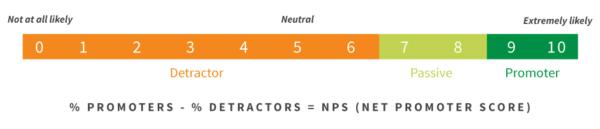
Net Promoter Score
where
- 9-10 indicates promoters
- 7-8 indicates passive
- 0-6 indicates detractors
You can calculate the Net Promoter Sore using the formula:
[(Total Number of Promoters – Total Number of Defectors)/ number of interviewers] x 100
3. Customer Satisfaction Score
Checking your customer satisfaction score is very important in every business, including product management or development. This KPI metric tells you whether or not your customers are satisfied with using specific features on your platform. Additionally, it helps you find which feature is least useful.
Customer Satisfaction Score is very easy to calculate and obtain. All you need is to ask the simple question: How satisfied are you with using this feature/platform?
From left to right (sad to grin emoji), the points allocated is 1, 2, 3, 4, and 5 respectively. This means the blue emoji signifies satisfaction. You can calculate your Customer Satisfaction Score using the formulas below:
(Total Number of Satisfied Customers (those who rated your platform with 4 or 5 points) /Tots Number of Respondents) x 100
For instance, let’s assume seven (7) out of 10 users rated your platform with 4-5 points. The resulting customer satisfaction score is given as follows:
7/10 x 100 = 70
FAQs on UX KPI
1. What are the most common KPIs?
As earlier mentioned, there are seven powerful UX KPIs to watch out for as a product manager, and they include;
- Task Success Rate
- Time on Task
- Navigation vs Search
- User Error Rate
- Net Promoter Score
- Customer Satisfaction Score
- System Usability Scale
2. Why are UX KPIs important?
UX KPIs are important because they help businesses understand how users are interacting with their products or services. By measuring UX KPIs, businesses can identify areas for improvement and make data-driven decisions to enhance the user experience.
Final Words
With the UX KPIs introduced above, you can easily measure the success and progress of your product. The corresponding results can be communicated with the appropriate team, so as to fix issues wherever possible.